Where AI Is Really Taking Hold Across the United States
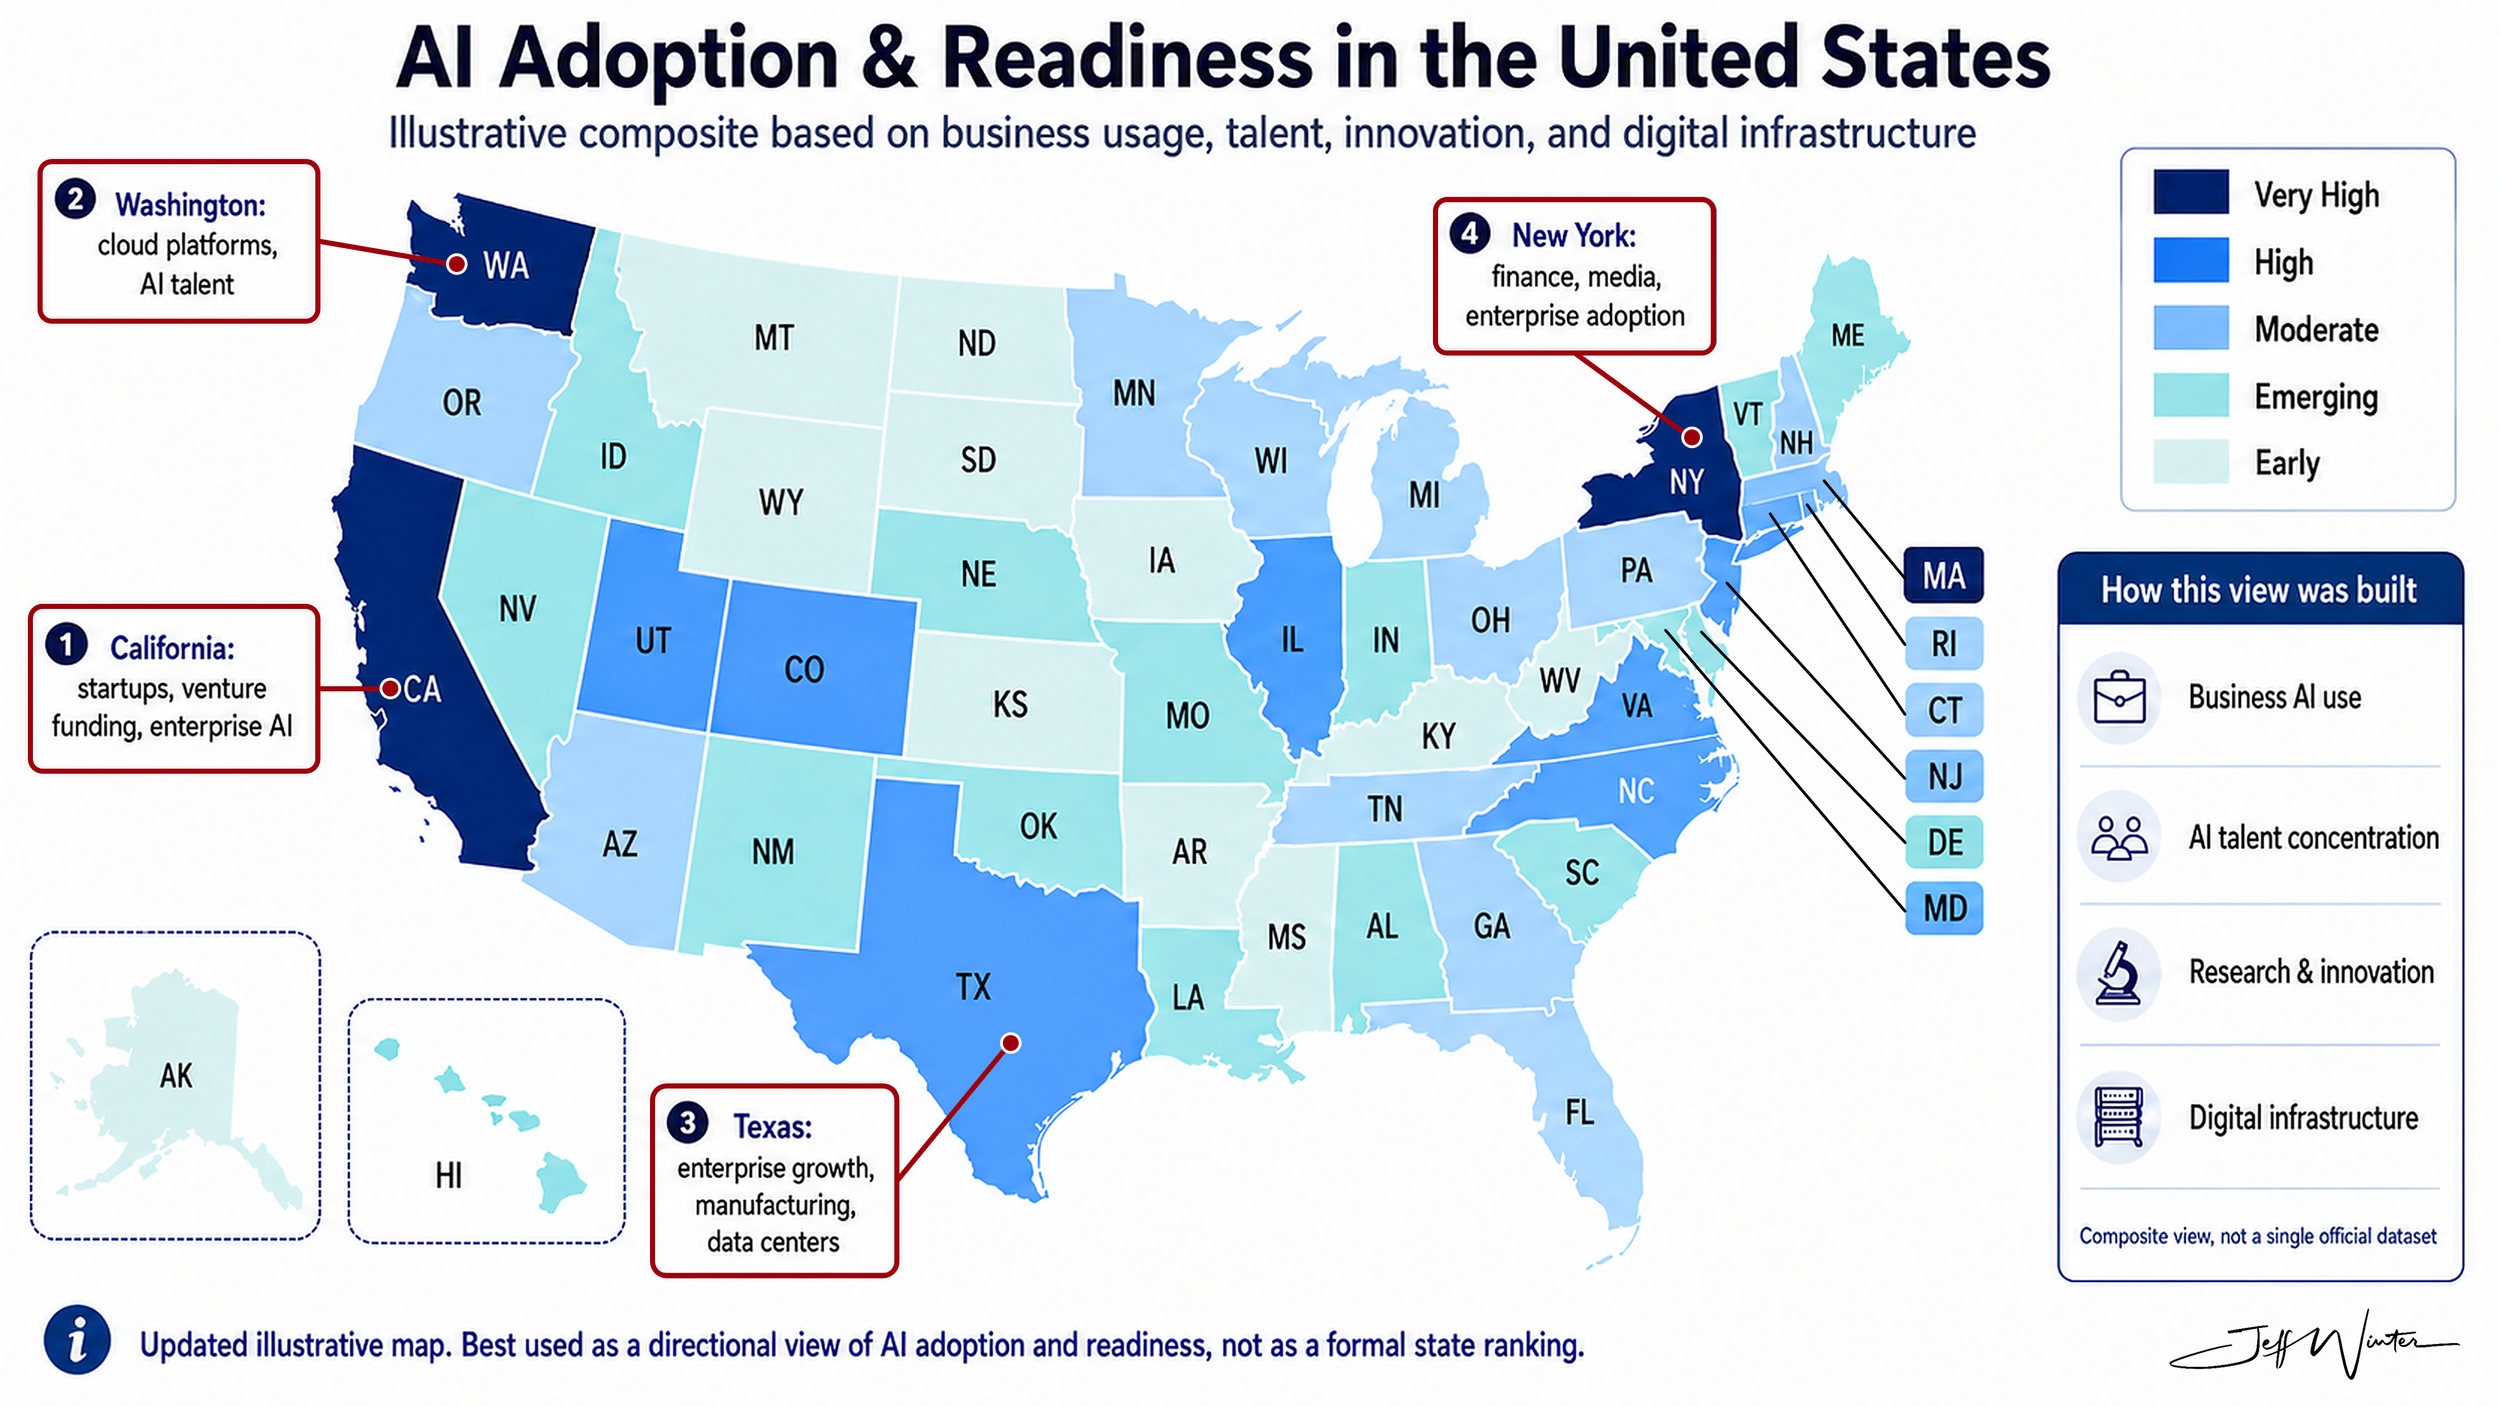
I hear constantly that AI is growing everywhere, but as I travel across the United States, that has not always matched what I see on the ground. Adoption, infrastructure, talent, and organizational readiness vary dramatically, so I wanted to understand just how uneven America’s AI progress really is and which states appear best positioned to lead.
A company in rural Iowa can access many of the same foundational models as a company in San Francisco. The software may arrive through the same browser, use the same cloud infrastructure and produce an answer in roughly the same number of seconds. Yet the two companies may have completely different abilities to turn that answer into anything economically meaningful.
That gap is what this map is really about. It is less a map of who has access to AI and more a map of who appears best positioned to do something consequential with it. Those are not the same thing. We have spent much of the last few years confusing access with adoption, adoption with capability and capability with value. They occasionally overlap, but not reliably.
I should state the obvious before someone else does it for me: this is not an official ranking. There is no definitive government table called “States That Are Best at AI,” and frankly, if there were, we would probably spend more time arguing about the methodology than reading the results.
This is my opinion as of August 2026 and based on the evidence I can see, the industries I follow and the patterns I have observed working around technology, manufacturing, infrastructure and digital transformation. I have tried to support that opinion with data. I have also made assumptions. Some are fairly safe. Others are judgment calls.
And Texas is complicated. We will get there.
AI is everywhere, except where it isn’t
Spend enough time at business conferences and it begins to sound as though every company is already operating an autonomous enterprise powered by AI agents, digital twins and a surprisingly well-governed data estate. Then you walk into the actual business and see things differently. Someone is exporting a spreadsheet. Someone else is trying to find the latest version of the spreadsheet. The maintenance records are handwritten. The CRM data is incomplete. A critical system still runs on a server that nobody wants to restart because the person who installed it retired in 2017. This does not mean businesses are not adopting AI. They are. It means adoption is happening inside a much messier operating reality than most AI presentations acknowledge.
According to the U.S. Census Bureau’s May 2026 analysis of the Business Trends and Outlook Survey, reported business use of AI moved between approximately 17% and 20% from December 2025 through May 2026. During the same period, roughly 20% to 23% of businesses expected to use AI within the following six months. Don’t get me wrong… that is meaningful growth, but it is also not universal adoption. The Census data become more interesting when company size is considered. Approximately 37% of firms with at least 250 employees reported using AI, while 32% of companies with 100 to 249 employees reported usage during the period ending May 3, 2026. The largest organizations are clearly moving faster. That is not shocking. They generally have more money, more data, larger technology teams and more ways to distribute the cost of experimentation across the organization. They also have more meetings about it, although I am not sure that helps.
A deeper Census Bureau working paper on the microstructure of AI diffusion found that 18% of firms used AI in at least one business function during the November 2025 through January 2026 reference period. When the results were weighted by employment, the figure rose to 32%. In other words, a much larger share of American workers may be employed by an AI-using company than the raw company count initially suggests. The same research found especially high use among very large firms in information, professional services and finance. Adoption in those groups reached approximately 50% to 60%, or 60% to 70% when weighted by employment.
That matters for a state map because industries are not sprinkled evenly across the country like seasoning. New York has finance, media and professional services. Washington has cloud platforms and enterprise technology. Massachusetts has biotechnology, healthcare and research. Texas has energy, industrial operations, corporate headquarters and increasingly enormous amounts of digital infrastructure. Different economic compositions produce different opportunities to adopt AI.
What exactly are we measuring?
This is where the entire exercise gets slippery. If I rank states by AI startups, California runs away with it. If I rank them by university research concentration, Massachusetts becomes even more formidable. If I rank them by data-center capacity, Virginia suddenly looks like the center of the known universe. If I rank them by industrial opportunity, Texas becomes much harder to keep outside the top tier.
The map therefore combines four things:
Business AI use
AI talent
Research and innovation
Digital infrastructure
I would probably weight them approximately 40%, 25%, 20% and 15%, respectively. I say “approximately” because this is not a calculated index pretending to possess decimal-point precision. I did not decide Texas scored 82.4 while Virginia scored 81.7. That would suggest a level of certainty the available data does not support. Broad tiers are more honest. There is another reason for including readiness alongside adoption. A state may not lead in current business usage but may have nearly everything required to accelerate: universities, skilled workers, industrial demand, cloud infrastructure and investment. Another state may report relatively strong usage because a small number of industries are adopting quickly, while lacking the surrounding ecosystem needed to sustain broader growth. Current adoption tells us where we are, whereas readiness tells us where this could go.
The business-use signal
The strongest direct measurement comes from the Census Bureau’s Business Trends and Outlook Survey, commonly called BTOS. The survey continuously measures business conditions and expectations and now includes more detailed questions about AI use within firms, business functions and worker tasks. The sample itself is pretty substantial. The Census Bureau has described BTOS as drawing from approximately 1.2 million businesses divided into rotating survey panels. (U.S. Census Bureau methodology announcement). It also releases information by state and by major metropolitan area, which is obviously helpful for something like this map.
There is a catch! There is always a catch (let’s out a devlish smile). The Census Bureau’s AI questions have changed over time. An earlier version focused on whether businesses used AI to produce goods and services. Under that narrower definition, only 3.8% of businesses reported usage in 2023. (U.S. Census Bureau, 2023)
The newer survey asks whether AI is used in any business function. That captures marketing, finance, human resources, administration, customer support and other activities that the earlier question could miss. It is a better measure of enterprise usage, but it means that putting the old 3.8% beside the newer 18% can exaggerate the apparent growth. Part of the increase is real. Part of it comes from asking a broader question. This is why survey wording matters. It is also why charts without footnotes occasionally cause me physical discomfort.
Talent, because someone eventually has to make this work
Buying an AI tool is easy. Making it secure, useful, integrated, governed and repeatable is not. This is especially obvious in industrial environments. I have spent enough time around manufacturing and operational technology to know that the impressive part is rarely the isolated demo. The impressive part is getting the technology to work reliably across old equipment, incomplete data, fragmented systems, cybersecurity requirements and people who already have full-time jobs. A model can produce a maintenance recommendation. That does not mean the plant has the sensor data, contextual information, workflow integration or confidence required to act on it.
Regions with strong technical talent have an advantage because they can solve those less glamorous problems. The problem underneath the problem is usually integration. The Brookings Institution’s 2025 regional AI-readiness analysis evaluated 195 metropolitan areas using 14 indicators across three pillars: talent, innovation and adoption. Talent indicators included science and engineering graduates, advanced research personnel and worker profiles containing AI-related skills. Brookings’ conclusion was not that every strong region looked the same. Quite the opposite. Some regions led through research, some through commercialization and some through enterprise adoption. The report also showed how concentrated the ecosystem remains. San Francisco and San Jose were the only metropolitan areas classified as AI “Superstars,” while a relatively small collection of “Star Hubs” and other emerging centers accounted for a disproportionate share of national AI activity. (Full Brookings methodology and report)
The Stanford Institute for Human-Centered AI’s 2025 AI Index provides another broad view of AI skills, investment, technical progress and geographic concentration. Its central message is similar: AI capabilities are expanding rapidly, but their benefits and the resources needed to create them remain unevenly distributed.
Research matters, even when it does not immediately look commercial
Research can be easy to underestimate because it frequently happens years before the market understands what to do with it. Universities produce graduate talent, foundational discoveries, spinout companies, intellectual property and relationships with government and industry. They also produce wonderfully specific academic paper titles that most normal people will never read, which is probably a separate measure of innovation.
U.S. higher-education institutions reported approximately $117.7 billion in research and development expenditures in fiscal year 2024, an 8.1% increase from the prior year. The activity was heavily concentrated among major research universities and medical institutions. (National Center for Science and Engineering Statistics, 2024 HERD survey). That number does not measure AI specifically. I would not use total university R&D as a substitute for AI adoption. It is a proxy for the research machinery surrounding advanced technology. A university can produce outstanding AI research while nearby businesses remain relatively slow adopters. Academic strength creates potential. It does not guarantee commercialization. Still, when a region combines major universities, hospitals, venture capital and experienced entrepreneurs, the distance between research and application tends to shrink. That is a large part of the Massachusetts story.
Infrastructure: the physical part of the supposedly virtual economy
AI discussions often become abstract very quickly. Models. Agents. Intelligence. Reasoning. But then as we have all learned….then someone has to find the electricity. The growth of AI is intensifying demand for data centers, networking, cooling, power generation and transmission capacity. Cloud computing may feel locationless to the end user, but the infrastructure is quite stubbornly physical.
According to CBRE’s North America Data Center Trends report for the second half of 2025, Northern Virginia recorded 1,102 megawatts of net absorption during 2025. Dallas absorbed 470.8 megawatts, an increase of 424 megawatts from the previous year. Across the major North American markets, data-center supply expanded 36% during 2025, net absorption increased 38% and vacancy fell to 1.4%. (CBRE, February 2026)
Infrastructure deserves a place in the methodology, but not too large a place. A data center in Virginia may serve a customer headquartered in New York, California or Europe. Hosting infrastructure does not mean that local businesses are advanced AI users. It does mean the region plays an important role in the physical economy supporting AI. This is why Virginia is “High” rather than automatically “Very High.” It may be the physical home of extraordinary amounts of computing capacity without being the home of every business benefiting from that capacity.
California: still the clearest leader
California is the least controversial top-tier state. It combines nearly everything: frontier AI companies, venture capital, technical talent, universities, patents, research laboratories, platform companies, enterprise customers and a culture that is unusually comfortable commercializing technology before the rest of us have fully decided what to call it.
The Brookings AI-readiness report placed San Francisco and San Jose alone in its “Superstar” category. No other metropolitan areas received that classification. That does not mean every part of California is equally advanced. California is a very large state, and the economic distance between Silicon Valley and many inland communities is considerable. This is one of the unavoidable weaknesses of using states.
The Bay Area can pull California into the darkest category even though the state contains regions with very different levels of technology investment and business readiness. But the strength of that cluster is so large that ignoring it would make the map less accurate, not more. California is not merely using AI. It is helping define the products, companies, labor markets and investment patterns through which much of the world accesses AI. That is a different level of influence!
Washington: the cloud is a place after all
Washington’s top-tier position is mostly a Seattle story. The region contains a deep concentration of cloud computing, enterprise software, engineering talent and major technology platforms. Much of business AI is delivered through cloud services, and a meaningful portion of the infrastructure, tooling and enterprise architecture behind that delivery is influenced by companies with a major presence in Washington.
Washington does not have California’s volume of AI startups or venture capital. If the map were primarily about company formation and early-stage funding, Washington could reasonably drop a tier. I gave more weight to cloud platforms and enterprise deployment capability. That is a judgment call.
My rationale is that AI adoption at scale will depend heavily on the platforms through which companies manage data, models, security and computing. Washington has enormous influence over that layer. I have worked around enough enterprise technology to be skeptical of any transformation story that skips the platform and infrastructure question. Eventually someone asks how the thing will be deployed, secured, integrated and paid for. The answer is frequently much less magical than the opening keynote implied.
New York: where AI meets expensive business problems
New York’s top-tier case is based less on frontier model development and more on enterprise demand. The state, and New York City in particular, contains finance, insurance, media, advertising, healthcare, law, consulting and corporate management. These are industries with enormous volumes of information and many expensive decisions. AI is especially attractive when a business has lots of data, high labor costs and repeated decisions that can be improved, accelerated or partially automated. New York has all three.
Brookings places New York among the leading regional AI hubs, supported by its technical workforce, startup activity, business base and access to capital. (Brookings regional AI analysis). New York is not California. But, it does not need to be. California’s strength is heavily connected to building AI companies and platforms. New York’s is connected to applying AI inside industries that control enormous pools of money, information and influence. The distinction between creating the technology and becoming excellent at using it may become more important over time.
And now Texas…
Texas is the state I debated the most. There is an entirely reasonable version of this map where Texas is “Very High.” In fact, if someone told me they weighted industrial AI, infrastructure and future growth more heavily, I would probably agree with their decision. Texas has multiple major economic centers, which is part of both its strength and its problem.
Austin brings software companies, startups, universities and technical workers. Dallas-Fort Worth brings corporate headquarters, telecommunications, logistics, financial services and data-center growth. Houston brings energy, healthcare, aerospace, engineering and large-scale physical operations. No single Texas city entirely defines the state’s AI ecosystem. That is unlike Washington, where Seattle dominates the story, or Massachusetts, where Boston and Cambridge account for an enormous portion of the relevant activity.
Dallas has become a particularly important infrastructure market. CBRE reports that Dallas-Fort Worth is now approximately a one-gigawatt colocation market, with about 700 megawatts under construction, 94.5% of which was already preleased. Another three gigawatts of greenfield development was planned, with strong demand from hyperscalers and AI providers. Those numbers are enormous. They still do not directly measure Texas business adoption.
This is where the argument turns. Texas may already be one of the most important states for the infrastructure and industrial application of AI. It may not yet match California in frontier innovation, Massachusetts in research concentration, Washington in cloud-platform density or New York in knowledge-industry adoption. So I kept it “High.” But barely.
My actual view is that Texas is the strongest challenger to the top tier and perhaps the state most likely to move into it. The industrial side is especially important. AI will not create its full economic value only by drafting emails, summarizing meetings and producing increasingly enthusiastic marketing copy. It will need to improve energy systems, manufacturing, logistics, maintenance, healthcare, construction and transportation. Texas has a lot of those problems. It also has the companies, infrastructure and capital to work on them.
A side note: some of the most interesting AI work I see is happening in places that do not always market themselves as AI companies. A manufacturer reducing unplanned downtime may create more measurable economic value than a startup releasing a clever consumer application. It just receives fewer dramatic headlines. That bias toward visible technology companies can distort how we think about geographic leadership.
Where this could go differently
There is no single correct version of this map because there is no single definition of AI leadership.
Weight current business usage more heavily and states with large finance, information and professional-services sectors may rise.
Weight university research and Maryland, Pennsylvania, Massachusetts and North Carolina become more prominent.
Weight infrastructure and Virginia and Texas move upward, with Arizona and Georgia becoming more interesting.
Weight industrial application and the Midwest changes considerably. Michigan, Ohio, Indiana and Wisconsin could become much more important as AI moves into production, quality, maintenance, engineering and supply-chain operations.
Weight activity per capita and smaller technology-heavy states gain ground.
Weight total dollars, workers or companies and the largest states dominate.
There is also a time problem. This map is a snapshot of a moving target. The economics of AI are changing rapidly because the technology itself is becoming less expensive to use. The Stanford 2025 AI Index found that the cost of querying a model performing around the GPT-3.5 level on the MMLU benchmark fell from approximately $20 per million tokens in November 2022 to $0.07 by October 2024, a decline of more than 280 times in roughly 18 months. Depending on the task, large-language-model inference prices were falling between ninefold and 900-fold per year.
That changes geography. When AI becomes cheaper and arrives preinstalled in ordinary business software, companies no longer need to be located near a frontier research laboratory to begin using it. Access spreads. But capability may remain concentrated because integration, data, governance and organizational change are stubbornly local problems. The tool can be delivered from the cloud. The work of redesigning the company cannot.
What I actually believe the map says
The states doing best with AI are not necessarily the ones talking about it the most. They are the states assembling a complete system around it. They have businesses willing and able to adopt the technology. They have people who can deploy it. They have institutions that produce knowledge and talent. They have capital and infrastructure. Ideally, they also have industries with real problems worth solving. A region can have a large AI economy because it creates AI products. Another can have one because it becomes exceptionally good at applying AI to energy, finance, healthcare or manufacturing.
Those are both forms of leadership. The first is easier to see. The second may create just as much value. California, Washington, Massachusetts and New York currently appear to have the most complete ecosystems, although for very different reasons. Texas, Virginia, North Carolina, Illinois and several others are close behind, with Texas carrying the strongest argument for promotion into the highest tier.
This is my opinion based on the patterns I see. It is informed by Census data, Brookings’ regional analysis, Stanford’s AI Index, university research statistics and data-center market information. It is also shaped by my own experience working around enterprise technology and industrial transformation, where the distance between an impressive demonstration and a repeatable operating capability is often much larger than anyone wants to admit.
That experience makes me less interested in who can generate the best demo and more interested in who can make AI work repeatedly, safely and economically inside a real organization. Because almost everyone has access now. The competitive advantage is increasingly about everything that has to happen after access.
References:
CBRE. (2026). North America data center trends H2 2025: Dallas–Fort Worth data center market. https://www.cbre.com/insights/books/north-america-data-center-trends-h2-2025/dallas-ft-worth-data-center-market
CBRE. (2026). North America data center trends H2 2025. https://www.cbre.com/insights/books/north-america-data-center-trends-h2-2025
CBRE. (2026). North America data center trends H2 2025: New York Tri-State data center market. https://www.cbre.com/insights/books/north-america-data-center-trends-h2-2025/new-york-tri-state-data-center-market
CBRE. (2026). North America data center trends H2 2025: Silicon Valley data center market. https://www.cbre.com/insights/books/north-america-data-center-trends-h2-2025/silicon-valley-data-center-market
Grundy, A., Breaux, C., & Khatiwoda, D. (2026, May 26). Large firms with at least 20 employees biggest AI users. U.S. Census Bureau. https://www.census.gov/library/stories/2026/05/ai-use-businesses.html
Maslej, N., Fattorini, L., Perrault, R., Gil, Y., Parli, V., Kariuki, N., Capstick, E., Reuel, A., Brynjolfsson, E., Etchemendy, J., Ligett, K., Lyons, T., Manyika, J., Niebles, J. C., Shoham, Y., Wald, R., & Clark, J. (2025). The AI Index 2025 annual report. Stanford Institute for Human-Centered Artificial Intelligence. https://hai.stanford.edu/ai-index/2025-ai-index-report
Muro, M., & Methkupally, S. (2025, July 16). Mapping the AI economy: Which regions are ready for the next technology leap? Brookings Institution. https://www.brookings.edu/articles/mapping-the-ai-economy-which-regions-are-ready-for-the-next-technology-leap/
Muro, M., & Methkupally, S. (2025). Mapping AI readiness: Which regions are ready for the next technology leap? Brookings Institution. https://www.brookings.edu/wp-content/uploads/2025/06/Mapping-AI-readiness-final.pdf
Muro, M., & Liu, S. (2021, June 8). The geography of AI: Which cities will drive the artificial intelligence revolution? Brookings Institution. https://www.brookings.edu/articles/the-geography-of-ai/
National Center for Science and Engineering Statistics. (2026). Universities report 8.1% growth in R&D expenditures in FY 2024, reaching $117.7 billion. National Science Foundation. https://ncses.nsf.gov/pubs/nsf26305
U.S. Census Bureau. (2026). The microstructure of AI diffusion: Evidence from firms, business functions, and worker tasks. Center for Economic Studies. https://www.census.gov/library/working-papers/2026/adrm/CES-WP-26-25.html